Historical Era:
Date Created:
Year Created: 2023
Historical Theme:
Categories of Documents:
Description:
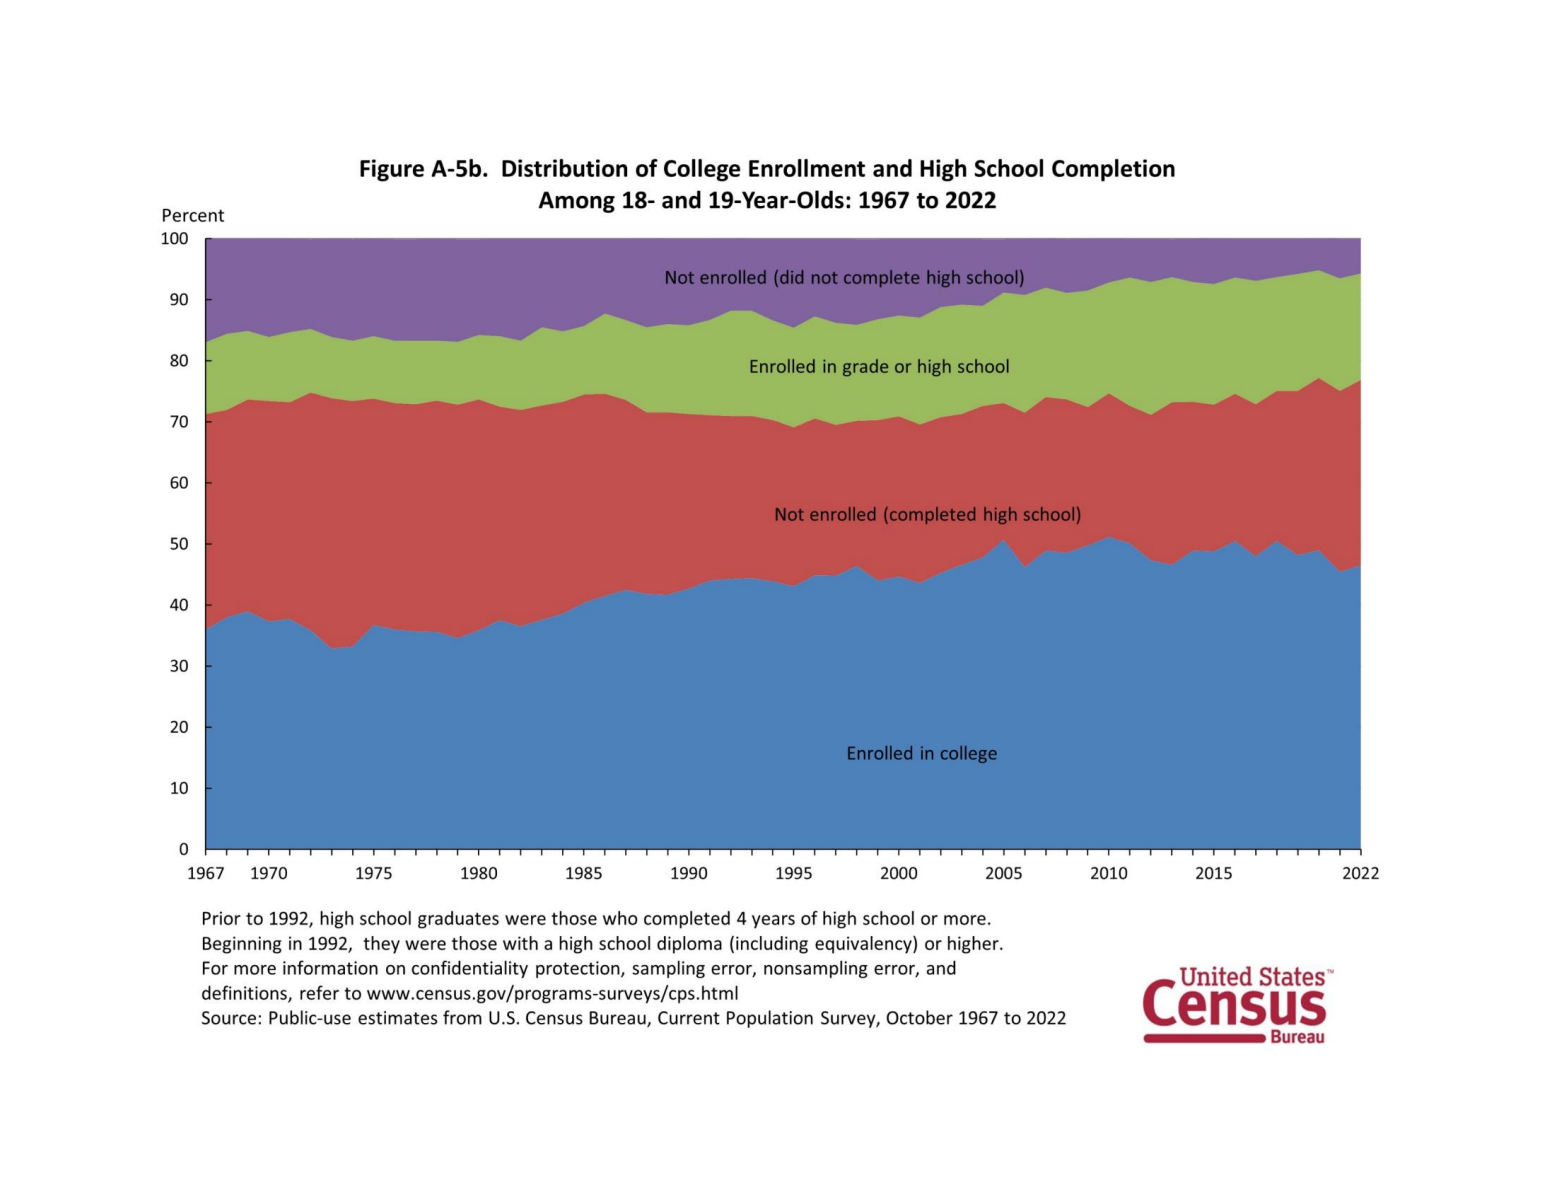
This chart illustrates the distribution of college enrollment and high school completion among 18 and 19 year olds from the years 1967 to 2022.
Source: Bureau, US Census. “CPS Historical Time Series Visualizations on School Enrollment.” Census.Gov, 23 Oct. 2023, www.census.gov/library/visualizations/time-series/demo/school-enrollment-cps-historical-time-series.html.